Optimising the yield and economic potential of high input cropping systems in the High Rainfall Zone
The High Rainfall Zone in southeastern Australia has high yield potentials for wheat and canola, but growers are faced with challenges about resource allocation in a relatively new and rapidly evolving cropping system. This project will develop tools that predict the production and economic response as well as the risks associated with applying the level of inputs needed for wheat and canola crops to achieve their potential in this region.
IPNI-2014-AUS-022
31 Oct 2016
Crop nutrient decisions in the high rainfall zone
Technical report released September 2016
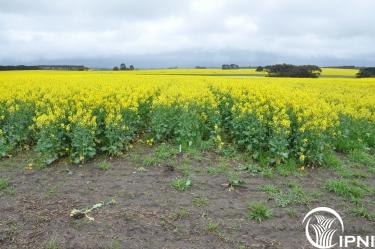 Canola experiment Tarringto, 2016
The project has field, survey, simulation and decision support components that aim to provide growers and advisers with tools that predict the production and economic responses, as well as the risks, associated with applying the level of inputs needed for wheat and canola crops to achieve their high yield potential in the HRZ of south-eastern Australia.
Field Component:
In the field component, a series of nutrient omission trials were established across 4 sites in 2015 in the south-east of South Australia and the HRZ of Victoria, and 6 sites in 2016. These experiments tested the response of wheat and canola to nitrogen (N), phosphorus (P), potassium (K), sulfur (S), coper (Cu) and Zinc (Zn).
• 2015 was unusually dry, with a decile 1 growing season. There were early biomass responses to N and P at most sites, but grain yield responses were recorded to N alone at one site, S alone at one site and N and P at another. There was evidence that the crops with higher fertilizer rates “hayed off” because of water stress during grain-fill.
• 2016 is experiencing well above average rainfall, with a decile 9 September.There are early biomass responses to P and N at most sites. In both seasons these responses occurred at soil test values well above the critical levels that were largely developed from low and medium rainfall cropping zones. Whether the 2016 biomass responses lead to higher grain yield will be determined by grain harvests scheduled over the next few months.
Survey Component
Samples of soil, grain and plant tissue were sought from farmer paddocks to determine the nutrient status of the population relative to critical values in the scientific literature. Soil sample data were also sought from a commercial soil test laboratory. A clear majority of samples were within the critical levels that had been determined previously. Overall soil fertility appeared to have increased over the past 30 years from that reported in the 1996 National Land and Water Resource audit nutrient database.
Simulation Component
A process-level model (CAT) of wheat and canola growth developed under a previous project was tested on data from a project on nitrogen response conducted by Southern Farming Systems (SFS) in 2013 and 2014. Model predictions conformed closely to the 1:1 line in a year of above average growing season rainfall (2013), but it underestimated grain yields by an average of 30% in a year where growing season rainfall was well below average (2014). This process-level model is therefore a good foundation for the decision support component of the project, providing reliable estimates of the grain yield response of these crops to climate and nitrogen, but is on the conservative side in its estimates under extremely dry seasonal conditions. The model has not, however, been tested on independent data for its response to P, K, S and micronutrients.
Decision Support Component
A review of existing decision support tools found that most addressed the response of crops to in-crop N. Most either used output from pre-run simulation models, or required user input for parameters such as yield potential. Within the DAV00141 project a new preliminary biophysical model was developed that predicts crop response to nutrients other than N. Two scenarios were undertaken, in which output from the biophysical model was used to populate an existing in-crop N calculator to determine the optimal rate of N application at various levels of P fertility. The analysis showed that the optimal rate of N is higher at higher levels of P fertility because of the higher yield potential.
A summary of the results of the omission trials from each site can be found by selecting the links at left.
Additional Resources
Technical Report - McCaskill et al.Size: 9.34 MB